
How Much Should You Keep in Checking? The Median American Keeps Exactly One Paycheck's Worth.
Key findings
- The median US household holds $2,803 in checking. Measured against what a household at that spending level actually spends, that is exactly 14 days — one biweekly pay cycle, to the day.
- 48.6% of households could not cover the 14-day gap to their next paycheck out of checking.
- The 10th percentile checking balance is $0.00. Not "a little" — nothing. 14.5% hold less than $100.
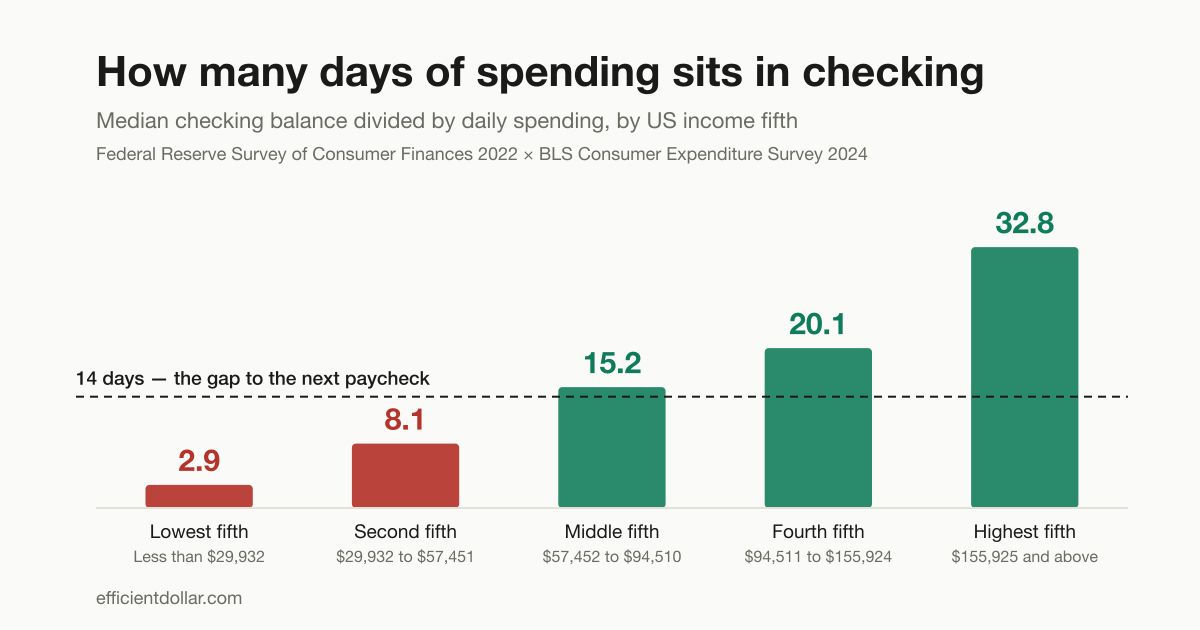
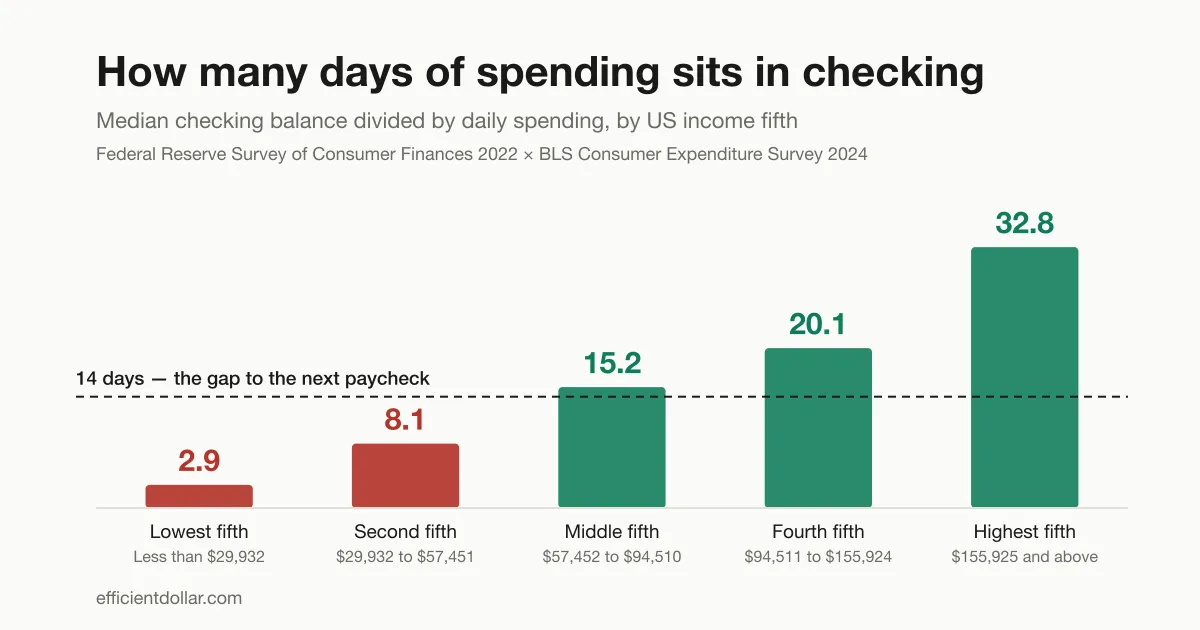
- By income fifth, the buffer runs 2.9, 8.1, 15.2, 20.1 and 32.8 days. The bottom two fifths are structurally unable to reach payday on what is in the account.
- The under-35 median is $1,608, and 28.6% of that group hold less than $500.
- The standard advice — one to two months of expenses — is describing an emergency fund, not a checking buffer. They have different jobs, and conflating them is why the advice is both unreachable and beside the point.
Search “how much should I keep in my checking account” and you’ll get the same answer about fifteen times in a row.
One to two months of expenses.
Nobody says where it came from. Nobody cites anything. It’s a number that has been passed between blog posts for twenty years the way a family recipe gets passed around, slightly changed each time, and no one remembers who made it first.
So I went and looked at what people actually do.
The Federal Reserve runs the Survey of Consumer Finances every three years, and it asks households — in some detail — what is in their accounts. It’s the same survey everyone quotes for net worth statistics. It also has a variable for checking account balances specifically, which almost nobody uses, probably because a dollar figure on its own isn’t very interesting.
Here’s the thing though. A dollar figure on its own isn’t very interesting. A dollar figure divided by what you spend in a day is extremely interesting, because that’s the number that decides whether you make it to Friday.
What Americans actually keep
The median US household holds $2,803 in checking.
That’s the middle. Half hold more, half hold less. And the shape of “less” is the part worth sitting with:
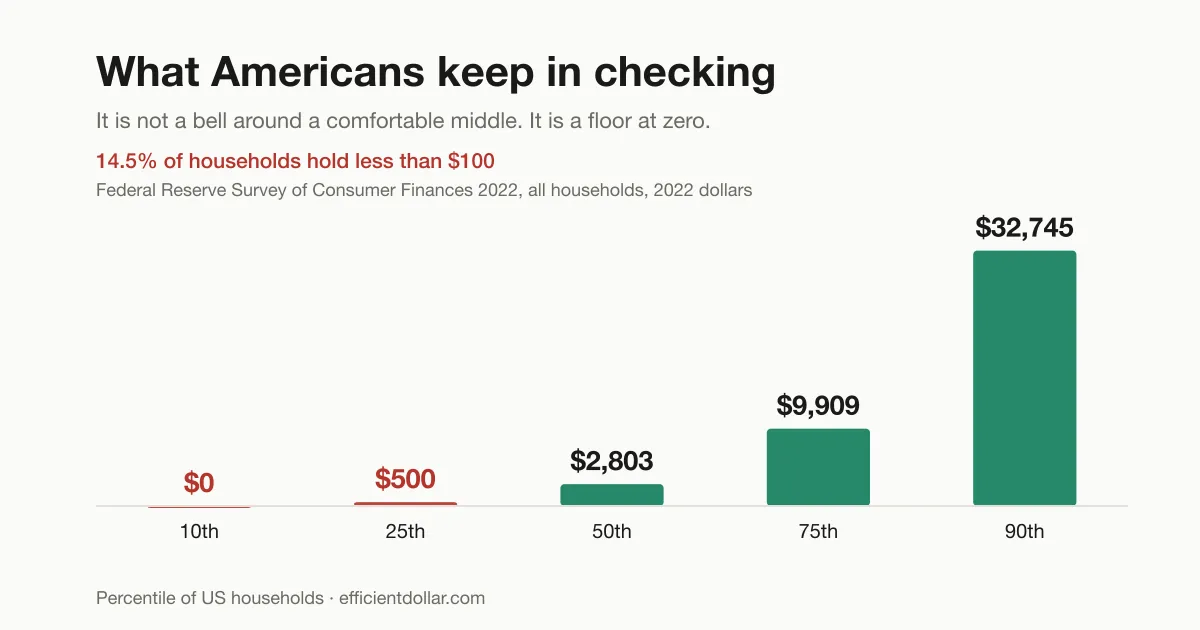
The 10th percentile is zero dollars.
Not a small number. Zero. At least a tenth of American households have nothing in a checking account at all, and 14.5% have less than a hundred dollars in one.
This is not a bell curve with a comfortable middle. It’s a floor, and then a long climb.
| Percentile | Checking balance |
|---|---|
| 10th | $0 |
| 25th | $500 |
| 50th (median) | $2,803 |
| 75th | $9,909 |
| 90th | $32,745 |
Federal Reserve Survey of Consumer Finances 2022, all US households, 2022 dollars.
One clarification, because it changes the number and I’d rather hand it to you than bury it. Those figures include households with no checking account at all, who hold zero by definition. Look only at households that have one and the median rises to $3,370, the 10th percentile becomes $200, and the share under $100 drops from 14.5% to 6.1%.
Both are true. They answer different questions. “What does a typical American household have in checking” includes the households that don’t have checking; “what does a typical checking account hold” doesn’t. I’ll use the all-households figures below and say so when it matters.
The unit that actually answers the question
Here’s where it gets useful.
$2,803 tells you nothing on its own. It’s a lot of money if your rent is $600 and it’s a rounding error if your mortgage is $4,000. What you want to know is: how long does that last?
So I took the Bureau of Labor Statistics’ Consumer Expenditure Survey — the other big federal survey, the one that measures what households actually spend — and divided.
The median household’s checking balance covers 14 days of spending.
Fourteen. Days.
The most common pay cycle in America is every two weeks. Which is also fourteen days.
I want to be careful not to oversell a coincidence, so let me say plainly what this is and isn’t. It isn’t a law of nature and it isn’t causal — I can’t tell you people aim at one pay period. What it is, is a statement about slack: the typical American checking account holds almost exactly the amount required to reach the next paycheck and not one day more. Break-even, on a good month.
And that’s the median. Half of households are below it.
How many days is yours?
A median is a fact about the country, not about you. Our free overdraft predictor takes your balance, your next payday and your bills, and shows you the day your own balance crosses zero — if it does.
Check my own numbersIt splits hard by income, and not the way you’d guess
Higher earners hold more in checking. That part is obvious and boring.
What’s less obvious is that they hold disproportionately more — not just more dollars, but more time. Spending rises with income, so if buffers scaled with spending, every group would sit at roughly the same number of days. They don’t. Not remotely.
| Income fifth | Income range | Median checking | Spends per day | Days of spending |
|---|---|---|---|---|
| Lowest | under $29,932 | $280 | $96.02 | 2.9 |
| Second | $29,932–$57,451 | $1,116 | $137.13 | 8.1 |
| Middle | $57,452–$94,510 | $2,780 | $183.29 | 15.2 |
| Fourth | $94,511–$155,924 | $4,965 | $246.50 | 20.1 |
| Highest | $155,925 and up | $13,530 | $411.90 | 32.8 |
Balances: SCF 2022, expressed in 2024 dollars. Spending: BLS Consumer Expenditure Survey 2024. Households are assigned to a band by their own income, using the CE's published dollar cutoffs.
The bottom fifth has 2.9 days.
Not 2.9 days of discretionary money. 2.9 days of everything — housing, food, transport, all of it. For a household in that band, “will I make it to payday” isn’t an anxious thought. It’s an arithmetic problem with a known answer, every single pay period.
The second fifth — households earning roughly $30,000 to $57,000, which is a very large number of working Americans — has 8.1 days against a 14-day gap.
The middle fifth clears it, barely, at 15.2.
That’s where the 48.6% comes from. Compare every household’s own balance to its own band’s 14-day spending, and nearly half cannot get there. Not “would find it tight.” Cannot.
The young are not doing worse because they’re young
The under-35 median is $1,608, against $3,443 for the over-75s.
The obvious read is that buffers build with age, and that’s partly right. But look at the shape rather than the middle: 28.6% of under-35 households hold less than $500, against 17.4% of the over-75s. The gap isn’t mostly at the top of the young distribution. It’s at the bottom.
| Age | Median checking | Share under $500 |
|---|---|---|
| Under 35 | $1,608 | 28.6% |
| 35–44 | $2,489 | 24.5% |
| 45–54 | $3,365 | 22.6% |
| 55–64 | $3,465 | 23.0% |
| 65–74 | $3,132 | 21.9% |
| 75+ | $3,443 | 17.4% |
SCF 2022, all US households, 2022 dollars.
Also worth noticing: the median stops climbing after 55. Buffers plateau around $3,400 and stay there. Whatever else is happening across a lifetime of earnings, the amount people leave sitting in checking is not what grows.
So: one to two months of expenses?
No. And the reason is that the advice is answering a different question.
One to two months of expenses is emergency fund advice, and emergency fund advice is good advice. An emergency fund exists to survive a job loss, a hospital bill, a transmission. It should be large, it should be boring, and it should be somewhere that pays interest and isn’t one tap away from a checkout screen.
A checking buffer has a much narrower job. It exists to absorb timing. Not catastrophe — timing. The rent that lands three days before payday. The annual insurance renewal you forgot renews in March.
Those are different jobs and they want different amounts in different places. Telling someone their checking account should hold two months of expenses does two bad things at once: it makes the target so far away that people stop aiming, and it points at the wrong account.
What to actually aim for
Three components. All of them are checkable, which is the main thing the rule of thumb isn’t.
1. The gap. Days until your next paycheck, times what you spend in a day. If you’re paid every two weeks and you spend $180 a day, that’s about $2,500 just to arrive at payday with nothing left.
2. The cluster. The largest single day of bills between now and then. Not the total — the biggest day. Rent and a car payment landing on the same Tuesday is the thing that breaks a buffer, and it doesn’t care that the month works out fine on average.
3. A margin. Enough that a payment posting two days early isn’t an event. Not a month of expenses. A cushion.
Add those three and you’ll usually get a number somewhere between one and three weeks of spending — smaller than the rule of thumb, and considerably more useful, because you can actually check whether you’re above it.
Which, honestly, is the whole point. A target you can’t measure yourself against isn’t a target, it’s a mood.
Work out your own three numbers
The free overdraft predictor does exactly this arithmetic: it walks your balance forward through every bill and paycheck for the next five weeks, and tells you the lowest point it reaches — and the date it goes under, if it does.
Open the overdraft predictorWhere the numbers come from
Balances are from the Federal Reserve’s Survey of Consumer Finances 2022 summary extract. The SCF publishes five imputations of every household, so each statistic here is computed inside each of the five and averaged, with percentiles interpolated between households rather than landing on one household’s exact balance — a steadier figure for a variable as lumpy as checking balances. The Fed publishes no checking-balance distribution to match against, which is why this differs from the site’s net worth, retirement and debt calculators: those pool the five imputations exactly as the Fed’s own tables do, so they can reproduce them. Percentiles are weighted by the survey’s own household weights.
Spending is from the BLS Consumer Expenditure Survey 2024, average annual expenditures by income quintile. Because the CE publishes explicit dollar cutoffs for its quintiles, each SCF household is assigned to a band by its own income rather than by its rank in a different survey — the two surveys define a “household” slightly differently, and rank-matching would quietly paper over that. SCF 2022 dollars are carried to 2024 with annual CPI-U (a factor of 1.0719) so the days-of-spending ratio compares like with like.
Two honest limitations. The days figure divides a median balance by a mean daily spend, because the CE publishes means only; using the SCF’s mean balance instead would roughly double every figure on the strength of the top few percent, which is exactly the misreading this piece exists to correct. And nobody spends evenly across a month — the figure is a measure of scale against the pay cycle, not a claim about any household’s Tuesday.
To check that the method is sound rather than merely plausible, I recomputed three statistics the Fed publishes itself using the same code: median net worth came out at $191,977 against the $192,900 in the Fed’s Bulletin, median transaction-account balances at $7,811 against $8,000, and median income at $70,475 against $70,300. Close enough, in all three, that the checking figures can be trusted to the dollar they’re quoted at.
Related: Why do I keep overdrafting? — the same numbers, pointed at the cause. And the overdraft predictor, which does this arithmetic for your own account.
Know what's actually safe to spend
Efficient Dollar tracks every account you connect and every bill automatically, then gives you one number each day: what you can spend without breaking anything later, including the bills that haven't hit yet.
Get early access